


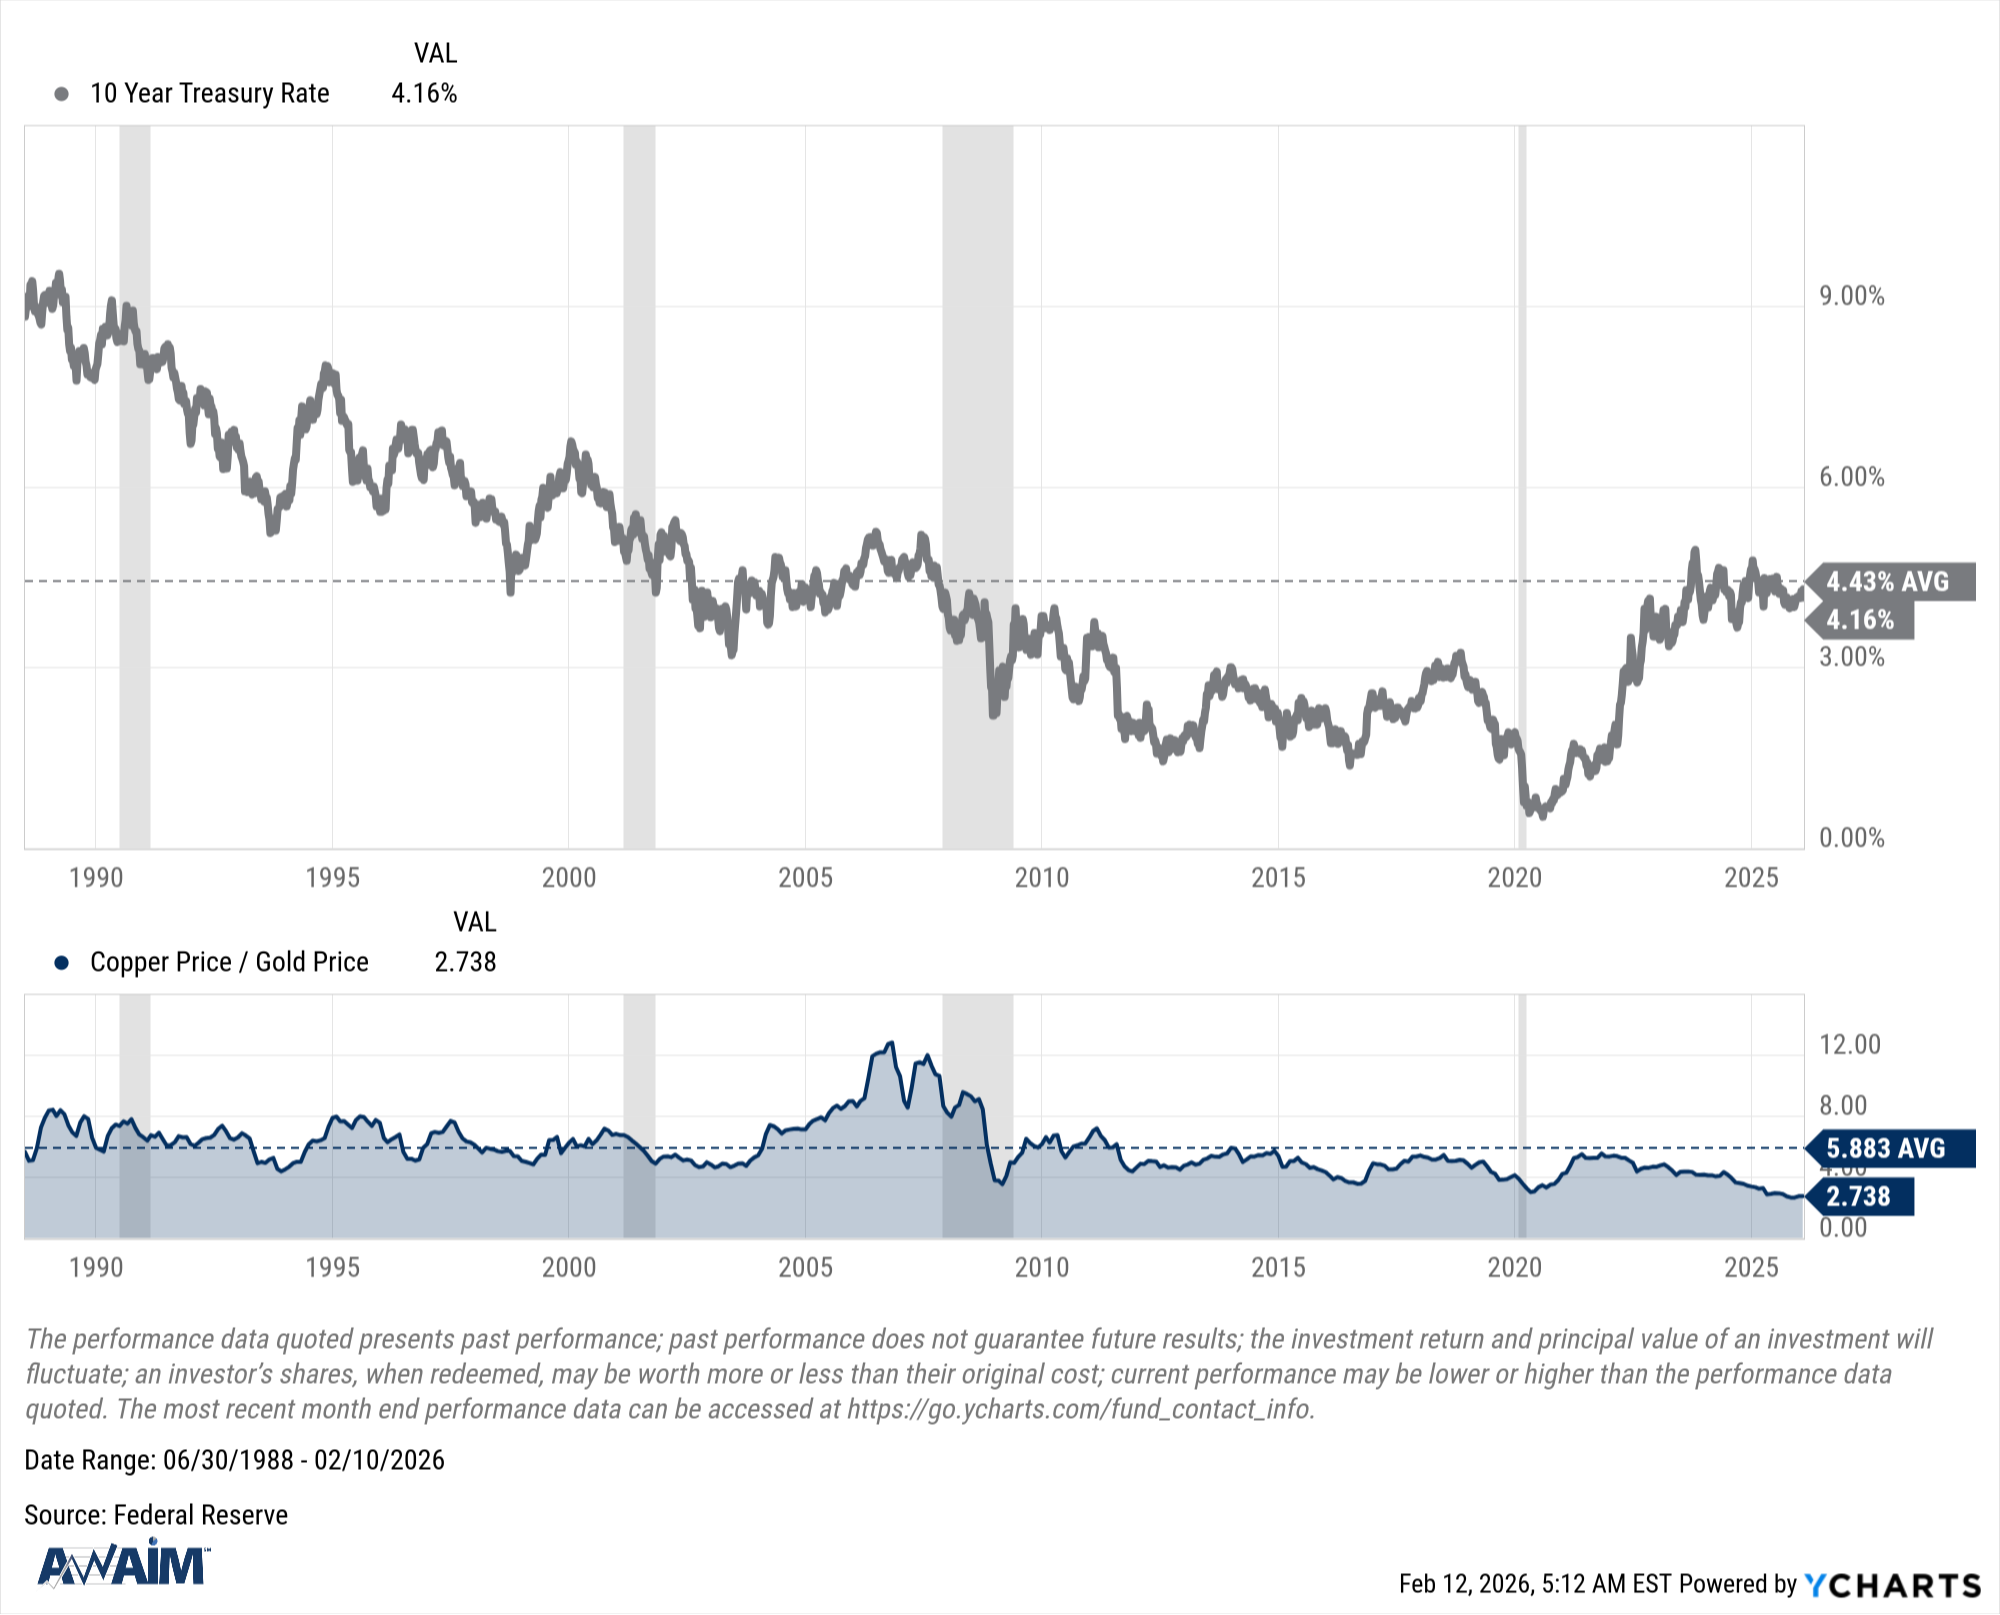
Our analysis of the copper/gold ratio alongside changes in the 10-year Treasury yield reveals a compelling, historically indicative pattern for major economic inflection points.
Notably, both series peaked in tandem in early 2020 before the pandemic-induced recession, and again in 2022 ahead of a growth slowdown. The copper/gold ratio acts as a global growth barometer—copper for industrial demand, gold for safe-haven sentiment. The 10-year yield reflects long-term growth and inflation expectations. Their synchronized movement underscores how market pricing of real economic activity and financial conditions are intrinsically linked.
The Copper/Gold ratio and 10-year US Treasuries yield are widely regarded as an advanced indicator for economic cycle and risk appetite. The copper/gold ratio tends to trend low when gold’s safe-haven demand outpaces the copper's industrial demand, signaling caution and risk aversion amid uncertainty. The 10-year US Treasury yield tends to trend higher when markets demand elevated compensation for long-term risks. This upward pressure stems from three main factors: persistent inflation keeps expectations elevated; exploding fiscal deficits and surging Treasury debt supply create persistent absorption challenges; and geopolitical and trade tensions prompt foreign holders to reduce reliance on US treasuries and mitigate sovereign issuer risk.
The most critical observation is that sharp, concurrent peaks in this relationship have preceded every major recessionary period in recent decades. The 2024 data point shows both metrics reaching unprecedented divergence. While not a timing tool, this atypical observation from long-run averages historically resolved through a corrective phase, often involving falling yields and a declining copper/gold ratio as growth concerns overtake inflation fears.
Investors should monitor the convergence of these two lines. A sustained rollover in both metrics would be a potent signal that markets are pricing in a material economic slowdown, reinforcing this model’s value as a strategic risk indicator.
Data Source: Internal Analysis, Federal Reserve. Chart for bond yield represents rate of change of treasury yield.